1 Vecto backend
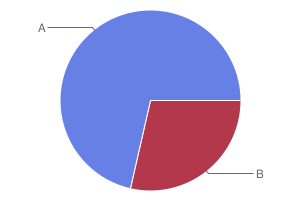
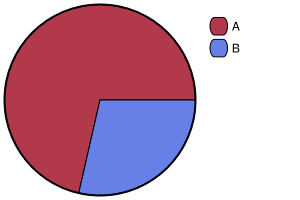
1.1 minimal pie
(with-chart (:pie 300 200)
  (add-slice "A" 5.0d0)
  (add-slice "B" 2.0d0)
  (save-file "minimal-pie-chart-vecto.png"))
1.2 larger pie
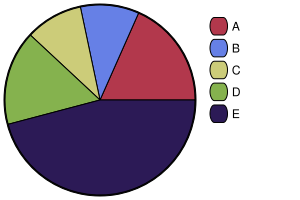
(with-chart (:pie 300 200)
    (loop for (label value) in '(("A" 400)
                                 ("B" 217)
                                 ("C" 212.5)
                                 ("D" 350)
                                 ("E" 1000))
          do (add-slice label value))
    (save-file "larger-pie-vecto.png"))
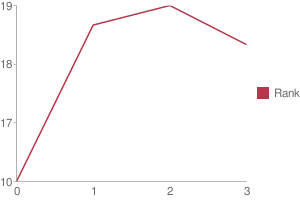
1.3 minimal line
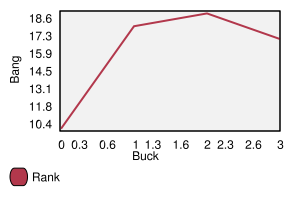
(with-chart (:line 300 200)
  (add-series "Rank" '((0 10) (1 18) (2 19) (3 17)))
  (set-axis :y "Bang")
  (set-axis :x "Buck")
  (save-file "minimal-line-chart-vecto.png"))
1.4 larger line
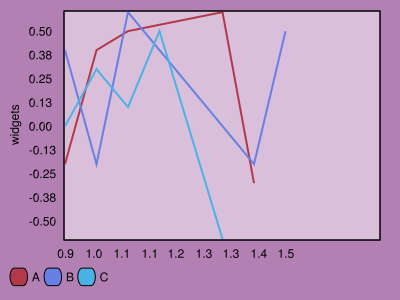
(with-chart (:line 400 300 :background '(.7 .5 .7))
  (add-series "A" '((-.1 -.2) (0 .4) (.1 .5) (.4 .6) (.5 -.3)))
  (add-series "B" '((-.1 .4) (0 -.2) (.1 .6) (.5 -.2) (.6 .5)))
  (add-series "C" '((-.1 0) (0 .3) (.1 .1) (.2 .5) (.4 -.6))
              :color '(.3 .7 .9))
  (set-axis :y "widgets" :label-formatter "~,2F")
  (set-axis :x nil
            :label-formatter #'(lambda (v)
                                 ;;could do something more interesting here
                                 (format nil "~,1F" (expt 2 v))))
  (save-file "larger-line-vecto.png"))
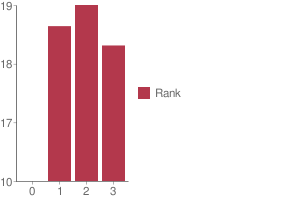
1.5 minimal bar
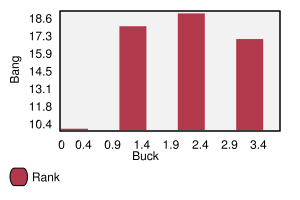
(with-chart (:bar 300 200)
  (add-series "Rank" '((0 10) (1 18) (2 19) (3 17)))
  (set-axis :y "Bang")
  (set-axis :x "Buck")
  (save-file "minimal-bar-chart-vecto.png"))
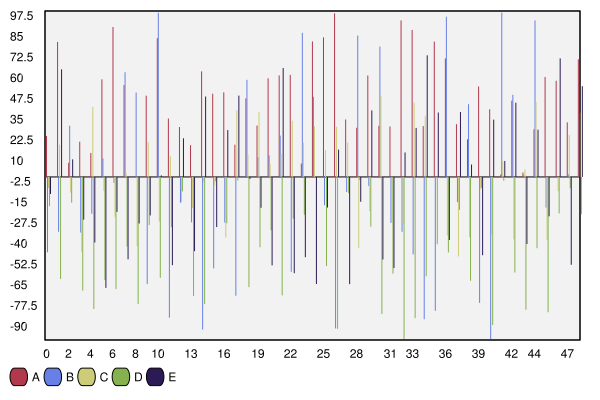
1.6 too many bars
(with-chart (:bar 600 400)
  (flet ((random-data (min max)
           (loop for i from 0 to 48
                 collect (list i (+ min (random (float (- max min))))))))
    (add-series "A" (random-data 0 100))
    (add-series "B" (random-data -100 100))
    (add-series "C" (random-data -50 50))
    (add-series "D" (random-data -100 0))
    (add-series "E" (random-data -75 75)))
  (set-axis :y nil :draw-zero-p T)
  (set-axis :x nil :data-interval 1)

  (save-file "too-many-bars-vecto.png"))
1.7 star rating
(with-chart (:star-rating 300 60)
  (set-rating 4.5)
  (save-file "star-rating.png"))

1.8 Mackey
(with-chart (:line 400 300)
  (add-series "test" '((1 0.0) (2 2.0) (3 3.0) (4 1.5)) :color '(0 0 1))
  (set-axis :y "amount" :label-formatter "~,2f")
  (set-axis :x "days" :data-interval 1
            :label-formatter (lambda (v) (format nil "~d" (round v))))
  (save-file "mackey.png"))
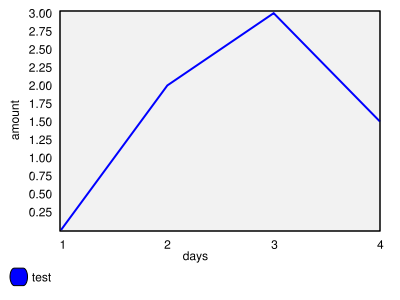
This came from a bug report from Stuart Mackey.
1.9 Seibel
These charts are too big for google to generate.
(let ((width 1264)
      (height 632))
  (with-chart (:line width height)
    (add-series "Rank" '((0 10) (1 18) (2 6) (3 17)))
    (add-series "25" '((0 25) (3 25)))
    (set-axis :y "Rank")
    (set-axis :x "" :data-interval 1)
    (save-file "seibel-1.png"))

  (with-chart (:line width height)
    (add-series "Rank" '((0 10) (1 18) (2 19) (3 17)))
    ;(add-series "Rank" '((0 10) (1 18) (2 6) (3 17)))
    (add-series "25" '((0 25) (3 25)))
    (set-axis :y "Rank")
    (set-axis :x "" :data-interval 1)
    (save-file "seibel-2.png")))
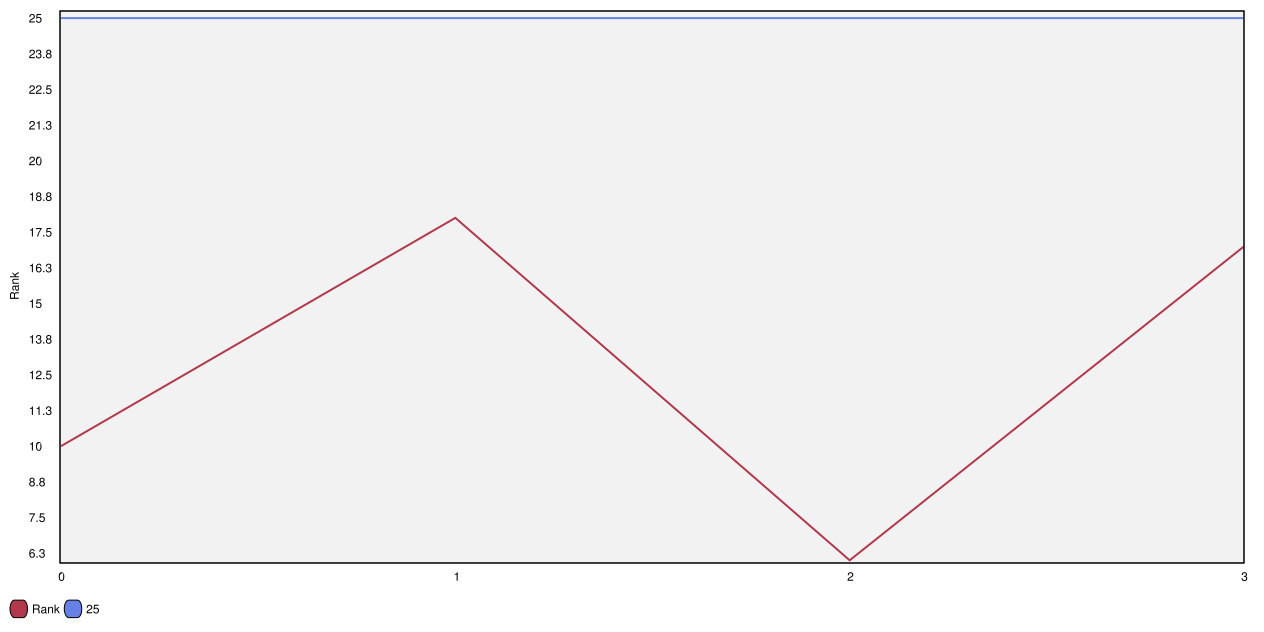
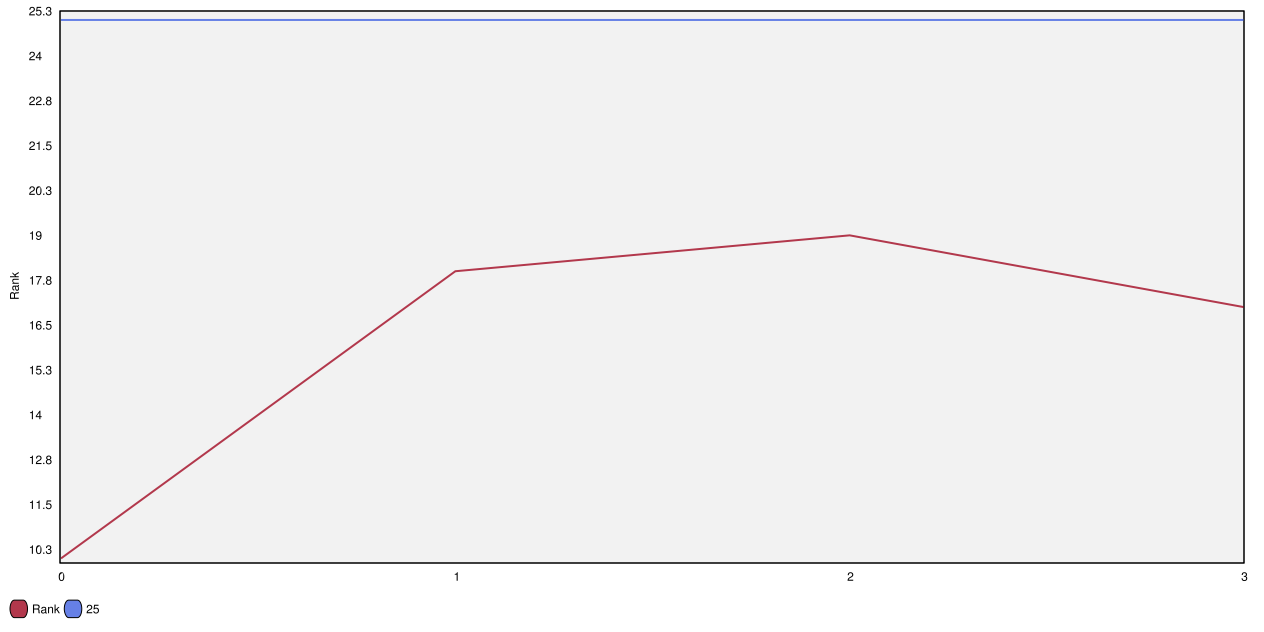
This came from a bug report from Peter Seibel.
